Semi-Log Graph Paper Templates
Download printable semi-log graph paper templates for science and math. Ideal for plotting exponential growth, decay, and data with one logarithmic axis.
Showing 1-4 of 4 records
Sort:
You are browsing category Semi-Log show all
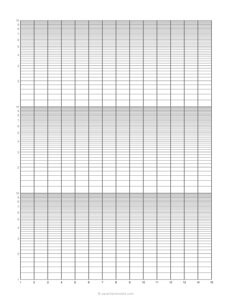
Semi Log Graph Paper - 3 Y-Cycles
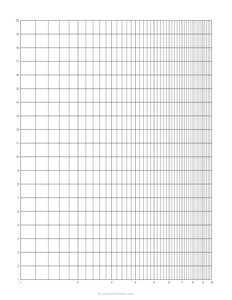
Semi Log Graph Paper
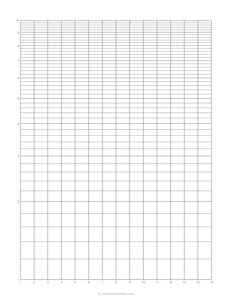
Semi Log Graph Paper - 1 Y-Cycle
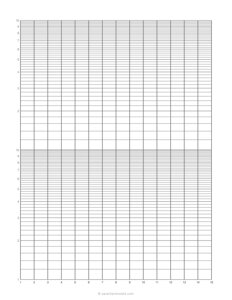
Semi Log Graph Paper - 2 Y-Cycles
Printable semi-log graph paper is used when one axis follows a logarithmic scale and the other uses a linear scale. This format is especially helpful for visualizing exponential growth or decay, allowing trends to appear as straight lines that are easy to analyze and compare.
Semi-log graph paper is commonly used in physics, chemistry, biology, economics, statistics, and engineering. It is ideal for plotting population growth, radioactive decay, interest rates, signal attenuation, and many other real-world datasets that change rapidly over time.
Our printable semi-log templates are clear, accurate, and print-ready, making them suitable for classroom teaching, homework assignments, lab reports, and professional analysis. The structured grid helps students understand logarithmic concepts while giving researchers and engineers a reliable plotting surface.
You'll find multiple layout options, including logarithmic X-axis or Y-axis versions, different grid densities, page sizes, and orientations. These templates work well for both printed use and digital annotation, and are available in formats suitable for design and technical workflows.