Cartesian Graph Paper
Free printable cartesian graph paper (also known as cartesian grid) with one or four quadrants. These printable PDF templates can be used in schools and colleges for graphing and plotting mathematical equations and more.
Recommended: Check out this Cartesian Graph Paper Maker to create custom style printable graph papers.
Showing 1-15 of 15 records
Sort:
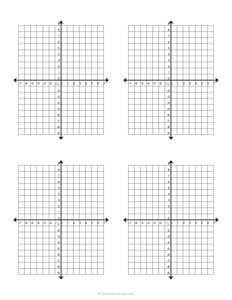
Cartesian Grid - Four Quadrant - 4 per page
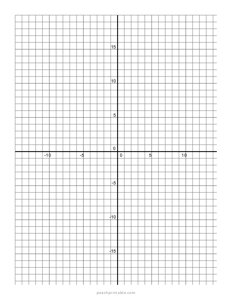
Cartesian Grid Paper - Four Quadrant
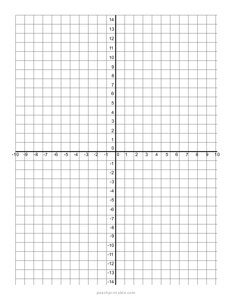
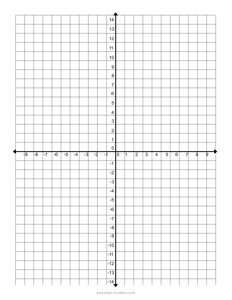
Axis Graph Paper - 7
Axis Graph Paper - 8
Axis Graph Paper - 5
Axis Graph Paper - 6
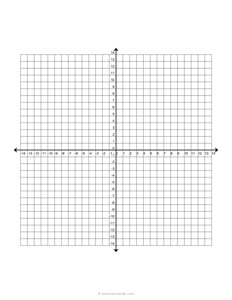
Cartesian Grid Paper - Four Quadrant Full
Cartesian Grid Paper - 4 per page
Axis Graph Paper - 11
Axis Graph Paper - 9
Axis Graph Paper - 3
Axis Graph Paper - 4
Axis Graph Paper - 2
Axis Graph Paper - 10
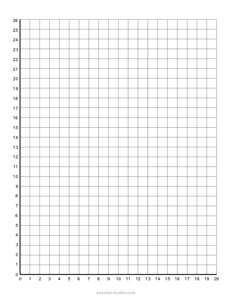
Axis Graph Paper
Cartesian graph paper, also known as grid paper or quad paper, is a type of graph paper that features a grid of evenly spaced horizontal and vertical lines forming squares or rectangles.
Features:
- Grid Structure: Cartesian graph paper consists of a grid of horizontal and vertical lines that intersect at right angles, creating squares or rectangles. Each square or rectangle represents a unit of measurement, typically defined by the spacing of the lines.
- Coordinate System: The Cartesian coordinate system, which is fundamental to Cartesian graph paper, uses two perpendicular axes—the x-axis (horizontal) and the y-axis (vertical)—to represent two-dimensional space. Each point on the grid corresponds to a unique pair of x and y coordinates.
- Standardization: Cartesian graph paper is often standardized with a specific number of squares or rectangles per inch or centimeter, allowing for consistent measurement and plotting of data.
Uses:
- Mathematics Education: Cartesian graph paper is widely used in mathematics education to teach concepts such as plotting points, graphing equations, and visualizing functions. Students learn to interpret graphs, identify relationships between variables, and solve problems graphically.
- Science and Engineering: In scientific and engineering fields, Cartesian graph paper is used for data analysis, experimentation, and visualization. Scientists and engineers plot experimental data, create graphs to illustrate trends and patterns, and analyze the behavior of variables in various experiments and studies.
- Function Plotting: Cartesian graph paper is particularly useful for plotting mathematical functions and equations. By plotting points corresponding to the coordinates of the function's output, individuals can visualize the shape and behavior of the function, including its intercepts, slopes, and curves.
- Statistics and Data Analysis: In statistics, Cartesian graph paper is used to create histograms, scatter plots, and other graphical representations of data. These visualizations help analysts understand distributions, correlations, and trends within datasets.
- Design and Drafting: Architects, engineers, and designers use Cartesian graph paper for sketching plans, diagrams, and blueprints. The grid structure provides a reference for accurately drawing to scale and ensuring proportional relationships between elements in designs.
- Geography and Mapping: Cartographers and geographers use Cartesian graph paper as a base for creating maps and spatial representations. The grid system allows for precise plotting of geographical features, coordinates, and boundaries.
Cartesian graph paper's grid structure and coordinate system make it an essential resource for visualizing, analyzing, and communicating data and ideas in two-dimensional space.