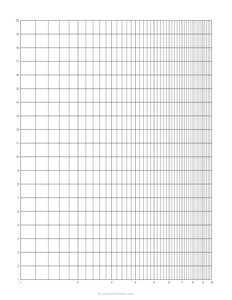
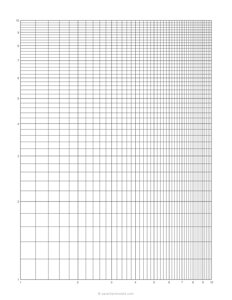
1/10 inch Logarithmic Graph Paper
Log-log paper has logarithmic scales on both axes and Semi-log paper has a logarithmic scale on one axis and a linear scale on the other.
- 1/10"
Showing 1-2 of 2 records
Semi Log Graph Paper
Logarithmic Graph Paper
Logarithmic graph paper, also known as log paper or log-log paper, is a specialized type of graph paper that uses logarithmic scales on both the horizontal and vertical axes.
In a logarithmic scale, each increment represents a multiplication or division by a constant factor rather than a fixed unit. Logarithmic graph paper is useful for visualizing data that spans a wide range of values, especially when those values vary exponentially.
Here are some key features and uses of logarithmic graph paper:
- Logarithmic Scales: Logarithmic graph paper features logarithmic scales along both the x-axis (horizontal) and y-axis (vertical). The spacing between the grid-lines represents multiples or divisions by powers of the logarithmic base.
- Exponential Relationships: Logarithmic graph paper is particularly effective for representing data that follows exponential growth or decay. In linear scales, exponential relationships appear as curved lines, but on logarithmic paper, they can be represented as straight lines.
- Scientific and Engineering Applications: Logarithmic graph paper is commonly used in scientific and engineering fields where data spans a large range, such as in physics, biology, chemistry, and electronics. It is valuable for plotting data related to exponential growth, decay, rates, and orders of magnitude.
- Financial and Economic Analysis: Logarithmic graph paper can be used in finance and economics to analyze data that exhibits compound growth or decay, such as population growth, investment returns, or economic indicators.
- Signal Processing: In signal processing and telecommunications, logarithmic scales are used to represent frequency spectra, signal amplitudes, and signal-to-noise ratios. Logarithmic graph paper is helpful for visualizing these relationships.
- Earth Sciences: Logarithmic graph paper is used in geology and other earth sciences to plot data related to seismic activity, geological time scales, and other phenomena that exhibit exponential behavior.
- Mathematics and Education: Logarithmic graph paper is used in mathematics education to teach concepts related to logarithms, exponential functions, and the properties of logarithmic scales.
When using logarithmic graph paper, it's important to understand how the scales are labeled and to interpret the data accordingly. Each cycle on the paper represents a factor of the logarithmic base, and this understanding is crucial for accurate analysis and representation of data with a wide range of values.


